Business Reporting: The Devil is in the Detail
27 Feb 2023
(Republished from earlier article)
When it comes to running (and growing) a business, I have always believed that you need to rely on both hard facts and gut feelings. The gut feelings you get only after years of experience. And the hard facts? Those come from reporting on your data relating to business performance.
So where does this data come from?
There are lots of different places, depending on which area of your business you want to focus on. You might look at data and reports from Google Analytics or your telephone system, but most often you’ll be turning towards your CRM system.
Your teams spend their days inputting data into a CRM, creating client records, activity schedules and email plans; all contributing to the top-quality service you deliver to your customers. Over the months and years, data builds up, giving you valuable insight into your customer base as well as your business.
Using your CRM system to build reports will give you an oversight of your business. It also gives you the ability to make decisions based on the information you gather there.
In this article, I’m going to explore how you can set up your CRM system to make this kind of reporting easy and my top tips on how to use these reports to make business decisions. And finally, I’m going to go through some examples of reports you can build in Open CRM to help you with various aspects of your business.
CRM and Reporting: The importance of data
The first step towards using your CRM for business reporting isn’t just about collecting lots of data (although our own graph nerd dashboard manager will always advocate for more). It’s about collecting the right data and this means thinking about what questions you want to ask.
Using sales as an example for this. Reporting on your Opportunities by value, expected close date, and salesperson is a great way to both forecast incoming revenue as well as team performance. And that’s fantastic.
But if you want to know where your best sales are coming from, it won’t help you one bit. Until you add a Lead or Opportunity Source to that Report. And make sure the team are filling that data in on each one of their Leads (and/or Opportunities).
Gathering lots and lots of data is great, but what you really want to do is gather the information that you can use to make the decisions that benefit your business.

Watch and learn
If you're looking for further information on how specific features and functionality play out in OpenCRM, why not click to check out our webinars?
watch nowAfter Report Action: Making intelligent decisions based on data
When I talk about making decisions based off data, I don’t mean that you should rely on reporting exclusively for new business ideas. But rather you use reports to inform where you should place your focus and then measuring how these new ideas are performing.
This time I’ll use an example from customer service. Let’s say that you’re thinking about adding Live Chat to your website as a way for your customers to get in touch.
The first thing you might want to do is have a look at how many calls and emails your customer service team are currently handling every day (or even hour). You might even look at average Ticket numbers each day and maybe the response and active times. This will give you a baseline to measure against.
If you aren’t collecting the source of these Tickets, that’s probably something you’d want to add at this point. That’s because it will give you a way to track which channel your customers are using, including your new Live Chat.
Let’s say that you’ve noticed, after the first couple weeks, that the number of calls has reduced significantly, but that the amount of time your team is taking to respond to and close Tickets has increased.
Digging into the issue shows that the number of Live Chats has skyrocketed…way above the number of a calls. Basically, your team is spending most of their time opening Tickets, rather than responding to and closing them.
The solution?
You hire a couple new people who’s only job (to start with) is to answer Live Chats.
After a few more weeks, you can see that the call and Live Chat numbers have stayed fairly static, but that your Ticket Active and First Response times have gone back down to more acceptable levels.
Now you may have noticed this increase and come to the same solution without using reports from your CRM and other systems. But it’s unlikely you would have noticed it or been able to assess whether your solution worked as quickly.
The Practical Details: Using your CRM for business reporting
In the examples above, I’ve given you a few ways you can gather data and create reports to support you making business decisions.
I’m going to carry on in the same vein in this section, but go into more concrete examples of how to build specific Reports in Open CRM.
Sales Forecasting
I already mentioned forecasting above, but I’d like to go a step further to show you exactly how to build the two Reports I mentioned. And a couple trick for getting this information side by side for comparison.
Building a sales forecasting report in Open CRM starts with you creating a Summary Report for the Opportunities module.
From there, you will:
- Select the following columns:
- Opportunity Name
- Assigned to
- Expected Close Date
- Sales Stage
- Lead Source
- Total Margin (or Total Amount or Weighted Amount – whichever your prefer)
- Group by:
- Assigned to – for the team performance report
- or
- Lead Source – for your sales source report
- Make sure to tick to Display Group Totals
- Columns to Total
- Total Margin (or either Amount field)
- Criteria
- Sales Stage does not contain “Closed”
- Specify Graph
- Vertical Bar with Sum Totals
Once you’ve got your Report(s) built, add them both to the same report block for your Dashboard and stick that block right at the top of your Homepage Components setup.
Now you can see both Reports with a single click, from anywhere in Open CRM.

Do we have what it takes?
We don't restrict which features you have access to in OpenCRM based on how many users you have. You get everything right out of the box. Click to find out if we've got the features you need.
find out moreCustomer Reports
There are certain reports you can create in Open CRM that will inform decisions you make relating to individual (or small groups) of customers. I’m thinking things like Outstanding Balance reports for a chase list.
But from a business standpoint, there are other ways of reporting on your customers that can inform decisions about general processes and relationship building.
The one I’d like to explore can be created as either a Report or Custom View in Open CRM and will show you any customers who you haven’t spoken to recently. Regularly use of this information will give you a list of customers who could do with a phone call or email as a way of health checking the relationship.
You can build this in either Contacts or Companies as either a Report or Custom View:
- Columns:
- First / Last Name (if Contact)
- Company Name (if B2B)
- Assigned to (if you have set account managers)
- Last Action
- Next Action
- Last Invoice
- Filter:
- Standard filter on Last Action
- Set to “More than 90 Days ago” or another period, depending on how often you contact your customers
- Advanced filter on Company Type to show your Customers
- Standard filter on Last Action
This will then give you a report or view of any customers who haven’t been contacted recently. You can then work your way down through the list, calling and/or emailing people or companies. As soon as you record an Activity or Email, the Last Action date will be populated and they will be removed from your list.
Business Trend Reporting
The final step is the one that truly allows us to work smarter. You will have no doubt heard of this before; Data Trend Analysis.
We have seen previously how reporting on our data in the right way, drilling into the detail, can identify areas of waste, but analysing this data over time will identify trends which cannot be seen in isolation.
Let’s look at an example again…
The support team manager runs monthly reports, gathering both basic and detailed performance data. After 3 years, they map their ‘Tickets Raised by Category’ report on a monthly graph.
They do this by creating a Summary Report on Tickets
- Columns: up to you, but you’ve got to include
- Created Month,
- Created Year, and
- Category
- Group by:
- Created year
- Category
- Created month
- Graph:
- Vertical Bar
- Graph Values: Number of Records
- Output Options: Stack first two groups
This will show a graph that looks a bit like this:
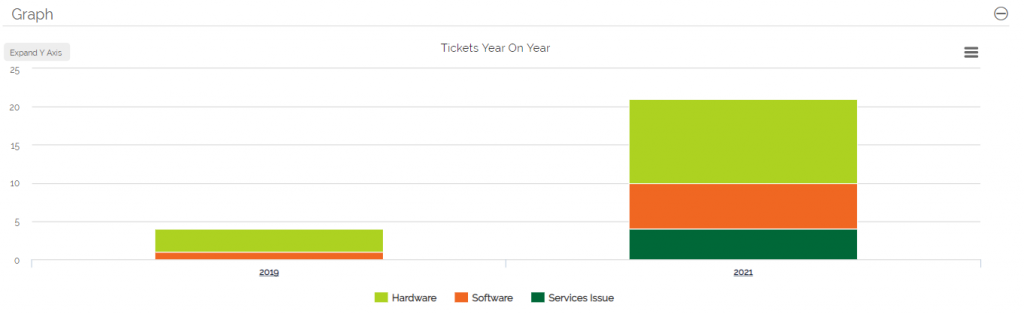
It shows the year along the bottom, with the number of Tickets in each Category for comparison. Clicking into each category will show you which month these were created in.
Let’s say you notice that over the last 3 years, in the months of November and December, ticket numbers for Hardware issues are at their lowest, whilst Software issues are at their highest.
Having identified this trend, you decide that in this winter period, surplus resource from Hardware will be reallocated to Software to cover the demand.
So now we have not only held our data in a CRM and generated detailed reports from it, we have compared our reports against one another, to identify trends which cannot be seen in isolation. In our example, there is no need to work harder to meet our demand, instead working smarter solves the issue in a productive and cost effective manner.

Let us take you on a tour
You've had a look around and are starting to think OpenCRM might be the system for you and your business. Why not chat with one of our team (and ask your burning CRM questions) as they take you on a tour of the system?
find out moreOur CRM (and other business) data, when reported on, can uncover our weaknesses and help us make better business decision.
If this is something you’re really keen on, you may also want to expand into using a dedicated Business Intelligence platforms. We use our own ClicData integration, for example, to combine Open CRM data with information from our other systems. Examining in for trends and giving us information to inform our business decisions.
Before I got my start in the tech industry as part of Apple’s UK Mac launch team, I was a professional drummer (notice I didn’t say musician). But once I got in, I was hooked and I’ve been involved in the tech industry, primarily software development, for over 35 years. I founded this company and I now have the enviable title of System Architect (as well as Managing Director) here at OpenCRM.